The business intelligence (BI) space is evolving fast in 2025, and data-driven decision-making is now a business essential. Whether you’re a startup or a Fortune 500 firm, tools like Power BI, Tableau, and Looker are leading the way in helping teams visualize trends and make strategic choices.
Power BI stands out for its cost-effectiveness and native integration with Microsoft 365 and Azure, making it ideal for businesses already in the Microsoft ecosystem. Tableau is favored for its powerful visual analytics and user-friendly interface, perfect for industries needing high-level data storytelling. Meanwhile, Looker, part of Google Cloud, offers a modeling layer via LookML and excels in scalable, governed data access, particularly for cloud-native teams.
Choosing the right BI platform depends on your team’s needs, technical environment, and budget. For a more detailed comparison, analytics training, and real-world use cases, check out AnalytiqLab—a go-to resource for data professionals and businesses navigating the modern analytics stack.
Overview: Understanding the BI Giants

Image Source
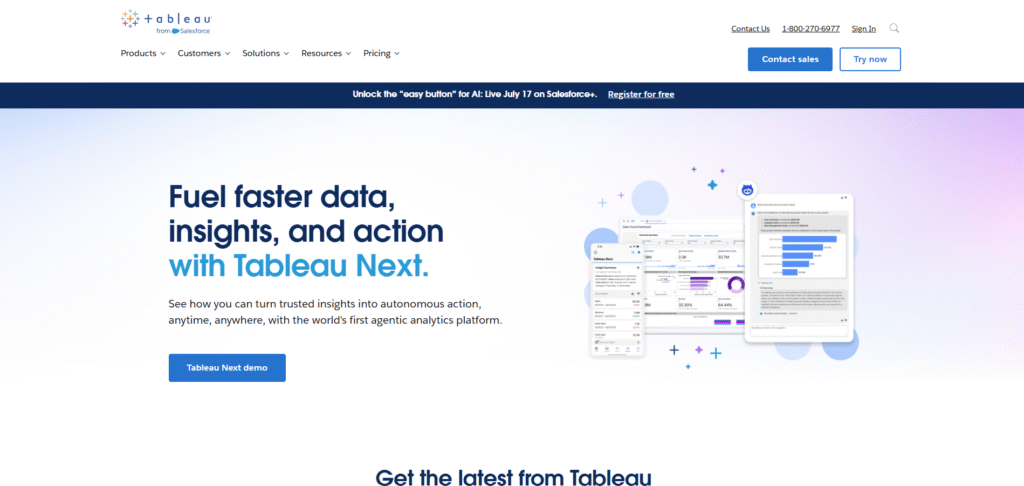
Tableau – The Data Visualization Trailblazer
Tableau, now a part of Salesforce, is widely praised for its ability to turn complex data into compelling, interactive visual stories. Known for its intuitive drag-and-drop interface, Tableau empowers users, even non-coders, to build advanced visualizations without writing a single line of code.
Key Strengths of Tableau:
- Exceptional data visualization and dashboard interactivity
- Vibrant user community and rich library of online tutorials
- Flexible deployment: available both in the cloud and on-premises

Image Source
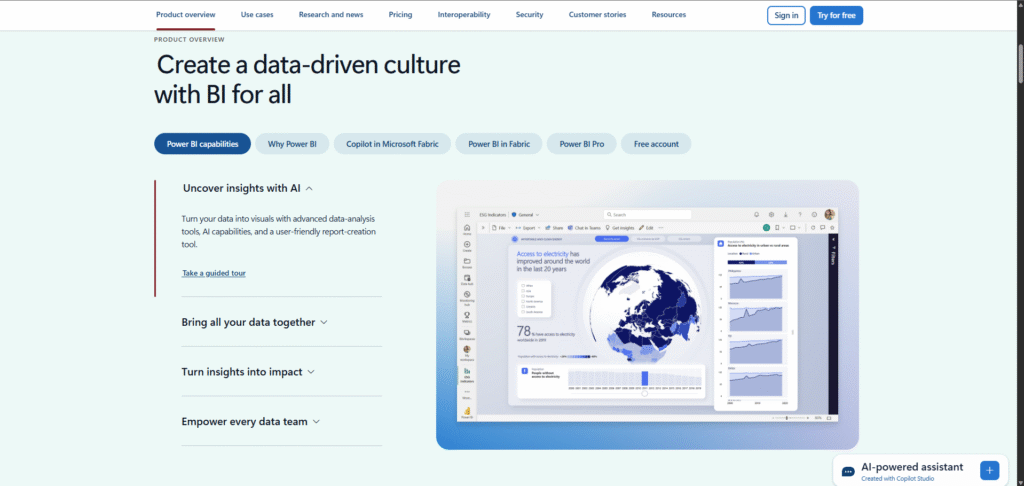
Power BI – Microsoft’s Data Analytics Powerhouse
Microsoft Power BI is a powerful business analytics tool that allows users to visualize data, uncover insights, and support data-driven decisions across teams and departments. Its deep integration with Microsoft products like Excel, Azure, and Teams makes it a top choice for organizations already using the Microsoft ecosystem.
Key Strengths of Power BI:
- Intuitive drag-and-drop interface for easy report building
- Native integration with Microsoft Office 365, Azure, and Teams
- Large, active community and extensive documentation for support

Image Source
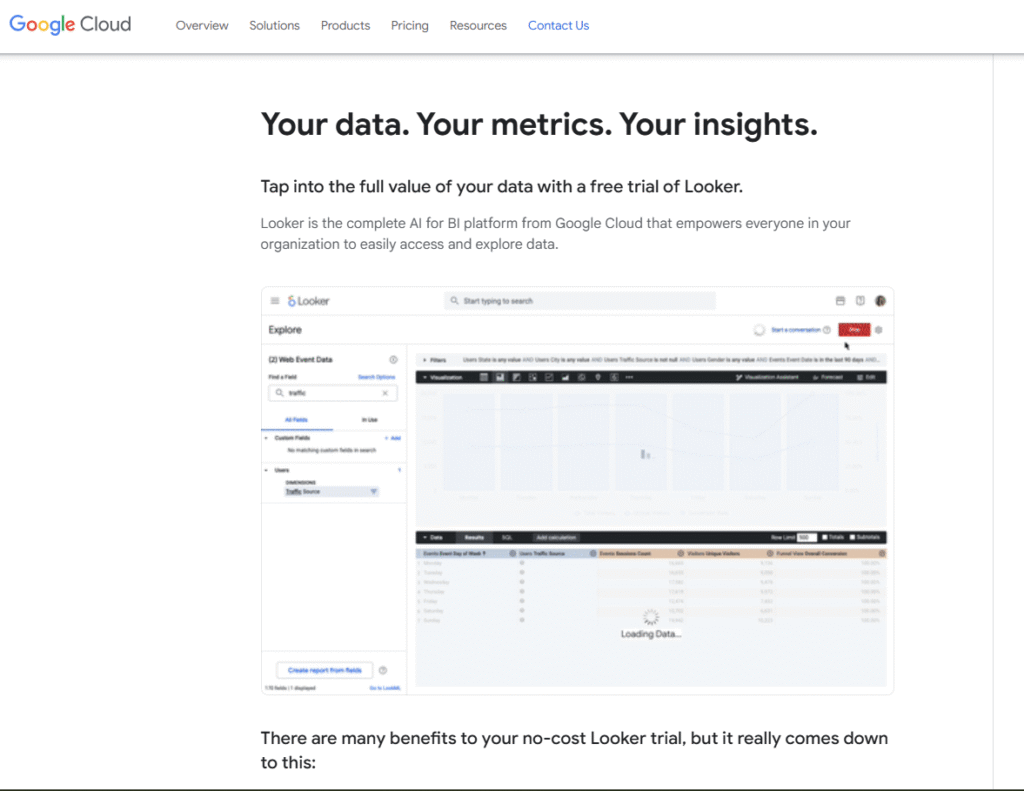
Looker – Google’s Modern BI Platform
Operating under the Google Cloud First strategy, Looker offers a modern business intelligence platform designed for data modeling, scalability, and embedded analytics. It’s particularly suited for organizations that rely on real-time insights and operate within a big data infrastructure at scale.
Key Strengths of Looker:
- Seamless integration with the Google Cloud Platform (GCP)
- LookML language enables customizable, reusable data models
- Emphasis on data governance, security, and embedded analytics capabilities
For in-depth comparisons, use cases, and tutorials on Looker and cloud-native BI tools, visit AnalytiqLab, your go-to hub for modern analytics learning and implementation guides.
Data Connectivity & Integration
Power BI
With 100+ built-in data connectors, Power BI enables seamless integration with a wide range of data sources, including SQL Server, Excel, Azure, Salesforce, Google Analytics, and many others. For organizations already invested in the Microsoft ecosystem, connecting to internal and external data becomes a smooth, near-effortless process—no complex configuration required.
Key Advantages of Power BI Data Integration:
- Real-time analytics through DirectQuery support
- Native integration with Azure Synapse, Dataverse, and Power Platform
- Effortless data import from Excel, SharePoint, and OneDrive
Tableau
Tableau offers extensive compatibility with a wide array of databases and cloud platforms, including Snowflake, AWS, Google BigQuery, and more. Its powerful in-memory engine, Hyper, ensures high-speed querying and optimized performance, even with large datasets. Whether you prefer live connections or in-memory extracts, Tableau offers flexibility and scalability for both analysts and enterprise teams.
Key Advantages of Tableau Data Connectivity:
- Supports both live and in-memory data connections
- Compatible with nearly all major data sources and data warehouses
- Full integration within the Salesforce ecosystem, enhancing CRM-based analytics
To explore how Tableau performs with large-scale cloud data and real-time dashboards, visit AnalytiqLab, a trusted source for Tableau tutorials, cloud BI comparisons, and data visualization best practices.
Looker
Looker shines in semantic data modeling through its proprietary language, LookML, which allows developers to define data logic centrally and reuse it across multiple dashboards and reports. While it offers fewer native connectors compared to Power BI or Tableau, Looker’s deep integration with Google BigQuery and other Google Cloud Platform (GCP) services makes it a top-tier choice for organizations built on modern cloud data warehouses.
Key Advantages of Looker Data Integration:
- Optimized for cloud-native architectures like BigQuery, Snowflake, and Redshift
- Centralized data modeling ensures consistent business definitions across teams
- Built-in Git-based version control for enterprise-grade collaboration and change tracking
Pros:
Data Visualization & Dashboarding
Power BI
Power BI delivers sleek, interactive dashboards and a growing library of customizable visuals designed for users across business functions. Its visual capabilities are highly effective for most reporting needs, though some data designers find Power BI slightly less flexible than Tableau when it comes to complex visual storytelling or high-end design customization.
Key Highlights of Power BI Visualizations:
- An extensive gallery of prebuilt visuals and a custom visual marketplace
- AI-powered insights with built-in support from Power BI Copilot
- Natural language Q&A allows users to query data conversationally and get instant visuals
Tableau
Tableau continues to reign supreme in data visualization, offering unmatched flexibility and design freedom. It empowers users to build visually rich, interactive dashboards that are not only responsive but also tailored for advanced data storytelling. Tableau’s combination of drag-and-drop simplicity and deep customization makes it the go-to choice for analysts and designers who want both control and creativity.
Key Highlights of Tableau Visualizations:
- Advanced charting and geographic mapping capabilities
- Drag-and-drop interface with fine-tuned customization options
- Support for animations, transitions, and storytelling dashboards
Whether you’re visualizing marketing trends or financial models, Tableau offers the tools to turn complex data into compelling stories. For expert tutorials and comparisons with other BI tools, explore AnalytiqLab, a trusted hub for data visualization and BI learning.
Looker
Looker takes a functional approach to data visualization, prioritizing data exploration and consistency over complex visual aesthetics. Its dashboards are clean, responsive, and highly embeddable, making Looker a favorite among developer-centric teams and companies looking to integrate analytics into their products or platforms. While it may not match Tableau in visual flair, LookML customization ensures that visual output remains tightly aligned with your data model.
Key Highlights of Looker Visualizations:
- Seamless embedding of charts and dashboards into web apps and internal tools
- Custom visuals powered by LookML-based definitions
- Minimalist, developer-friendly UI that ensures performance and scalability
4. Ease of Use and Learning Curve
Power BI
Power BI is designed with business users in mind. If you’re familiar with Excel or pivot tables, the transition is seamless. However, advanced analytics may require some DAX (Data Analysis Expressions) knowledge.
Learning Curve:
Easy for beginners
Some learning is needed for DAX and Power Query
Tableau
While Tableau offers a simple UI, mastering it for advanced use (especially data prep) can take time. Tableau Prep helps, but the platform is best leveraged by data-savvy users.
Learning Curve:
Intuitive visual creation
Moderate learning is required for data prep and scripting
Looker
Looker is more developer-oriented. Users must learn LookML for full control, making it better suited to teams with technical data professionals.
Learning Curve:
High if using LookML
Easier with embedded dashboards for casual users
Pricing Comparison (2025 Estimates)
| Tool | Pricing Model | Approx. Entry Price (2025) | Free Trial Available |
| Power BI | Per user/capacity | $10–$20/user/month | Yes (Power BI Desktop) |
| Tableau | Per user (Creator, Viewer) | $15–$70/user/month | Yes (14-day trial) |
| Looker | Custom enterprise pricing | Varies by usage | Limited |
Note: Power BI is often considered the most cost-effective. Tableau provides tiered access (Viewer, Explorer, Creator). Looker’s pricing is flexible but opaque, typically aimed at enterprises.
Collaboration & Sharing
- Power BI: Embedded reports in Teams, SharePoint, or web apps; Power BI Service enables group collaboration with secure access.
- Tableau: Share dashboards via Tableau Online or Server; strong integration with Slack (Salesforce advantage).
- Looker: Emphasizes embedded analytics in custom portals or apps; excellent API support.
If internal collaboration is your goal, Power BI and Tableau both excel. For customer-facing analytics or SaaS integrations, Looker is a strong choice.
Security, Governance, and Scalability
Power BI
Integrated tightly with Microsoft’s security ecosystem, Power BI supports:
- Azure Active Directory (Azure AD) for user authentication
- Row-level security (RLS) to control data visibility
- Data Loss Prevention (DLP) policies for secure data handling across Microsoft services
Tableau
Offers robust enterprise controls, ideal for regulated industries:
- Role-based access control (RBAC) for granular permissions
- Row-level security for data partitioning
- Compliance support for HIPAA, GDPR, and other frameworks
Looker
Best known for centralized data governance through LookML:
- Ensures consistent metric definitions across all dashboards and teams
- Fine-grained access control through developer-defined data models
- Excellent for organizations prioritizing governed self-service BI
Use Case Recommendations
| Use Case | Recommended Tool |
| Microsoft-centric organizations | Power BI |
| Data storytelling and design-rich visuals | Tableau |
| Embedded analytics in SaaS platforms | Looker |
| Budget-conscious SMBs | Power BI |
| Developer-first data teams | Looker |
| Marketing and executive dashboards | Tableau |
Conclusion: Choosing the Best BI Tool for 2025
When comparing Power BI, Tableau, and Looker, the best choice ultimately depends on your organization’s goals, budget, technical capabilities, and preferred cloud infrastructure. Each platform brings unique strengths to the table, making them suitable for different business needs.
Choose Power BI if you’re looking for a cost-effective, enterprise-grade BI solution that integrates seamlessly with Microsoft tools like Excel, Azure, and Teams. It’s ideal for businesses already within the Microsoft ecosystem and seeking strong AI-powered insights with minimal setup.
Choose Tableau if your focus is on advanced data visualization, interactive dashboards, and intuitive, drag-and-drop design tailored for business analysts and decision-makers. It’s perfect for users who want to explore and present data creatively without coding.
Choose Looker if your organization values centralized data modeling, embedded analytics, and tight integration with Google Cloud Platform (GCP). It’s best suited for data teams with strong engineering support and a need for scalable, governed analytics across departments or products.
For deeper insights, hands-on tutorials, and expert comparisons of BI tools, visit AnalytiqLab, your trusted resource for business intelligence learning and cloud analytics guidance.
Featured Image is Image by freepik

